ArcGIS Pro - Beispiel 9:
Für die im Beispiel 6 kartierten Altlastenverdachtsflächen
soll ermittelt werden, welche Nutzungsparzellen von den
Altlastenverdachtsflächen betroffen sind und wie insgesamt die
Landnutzungstypen-Bilanz aller Altlastenverdachtsflächen aussieht.
Darüber hinaus soll geprüft werden, ob die Landnutzungsklassifikation
noch aktuell ist oder ob sich mittlerweile Veränderungen in der
Landschaft ergeben haben. Letzteres soll unter Einbindung eines
WebMapping Service (WMS) von Ortho-Luftbildern des Landes NRW visuell
erfolgen.
Arbeitsanleitung:
Nach dem Öffnen der Karte zum Beispiel 6 visualisieren wir die
Altlastenverdachtsflächen und die Nutzungsparzellen im kartierten
Gebiet.
Beide feature classes bestehen aus polygonalen Geoobjekten. Um die
Betroffenheit von Nutzungsparzellen durch Altlasten zu ermitteln,
müssen wir die beiden bislang nur visuell überlagerten Layer
auch rechnerisch durch polygonales overlay überlagern, also die Polygone der beiden Layer miteinander
verschneiden. Dabei entstehen hinsichtlich Geometrie, Topologie und
Attributierung neue Polygone, die sowohl das Attribut Landnutzungstyp
als auch das Attribut Altlasten-Art aufweisen.
In der Toolbox (oder direkt in dem Hauptmenue Analysis) bekommen wir unter Geoprocessing >> Intersect für die Lösung derartiger Aufgaben verschiedene Methoden
angeboten. Die Bedeutung einiger dieser Methoden soll zunächst im Überblick
erläutert werden:
| Werkzeug |
Methode |
Anmerkungen |
Intersect:
ArcToolBox
Analysis Tools >> Overlay >> Intersect

|
Use Intersect when you want
to overlay a layer with the polygons in another
layer so that the resulting output layer a) has the combined attribute
data of the features in the two inputs, and b) only contains features
that fall within the spatial extent of the overlay polygons. In this way,
you can find just those features that overlap and 'stamp' the attributes
of the overlay polygons in the second layer onto the features in the first
layer.
For example, suppose you are researching areas where it may be hazardous
to perform new building. You have one layer containing areas prone to
flooding, and you have another layer containing areas where the soil is
prone to erosion. You would like to be able to analyze those areas that
are common to both. By intersecting the two layers, you'll create a new
layer containing polygons which represent the areas that are prone to
both flooding and erosion, and which have all the attributes of both sets
of input features. With this new layer, it's easy to perform your analysis.
For example, you can now use the Select By Attributes command in the Selection
pulldown menu to select polygons in the new layer that have some particular
combination of flooding and erosion attributes, such as particularly high
rates of flooding and erosion. |
You can intersect polygons
with polygons or intersect lines with polygons. For example, you could intersect
a roads layer with the layer containing areas where the soil is prone
to erosion to create a layer contain just those road segments that fall
inside those areas.
If you want to 'stamp' point features with the attributes of the polygon
features they fall inside, try using the ArcMap Join command (right-click
the point layer in the Table Of Contents and choose the Join command).
You can specify that the intersection be
limited to the currently selected set of features in either or both
of the two inputs. |
Union:
ArcToolBox
Analysis
Tools >> Overlay >>
Union

|
Use Union when you want to overlay two polygon layers so that the resulting output
layer a) has the combined attribute data of the polygons in the two inputs,
and b) contains all the polygons from the
inputs, whether or not they overlap. In this way, you can produce a new
layer combining the features and attributes of two polygon layers.
For example, suppose you have a layer containing land parcels and another
layer containing planning zones with zoning and permit attributes. You
would like to 'stamp' the land parcels with the zoning and permit attributes
of the planning zone in which they occur, so that you can perform selection
queries on the parcels based on these attributes. By unioning the two
layers you'll create a new layer that contains new polygon features made
up from the boundaries of the polygons in the two inputs. For example,
if a land parcel falls across two planning zones, it will be split into
two separate polygons each containing the portion of the parcel falling
each zone. Parcels that aren’t overlapped by planning zones, and
zones that don't overlap any parcels, will also be present in the output
layer (unlike in the Intersect geoprocessing operation, where only polygons
that overlap would be retained in the output). |
You can specify that the union be limited
to the currently selected set of features
in either or both of the two inputs.
If you only want a subset of the features in either or both layers to
be used in the process, select these features using any of ArcMap's feature
selection tools before you start the Geoprocessing wizard. Then on the
second panel of the Geoprocessing wizard, check the appropriate 'Use selected
features only' box. |
Clip:
ArcToolBox
Analysis
Tools >> Extract >>
Clip
|
Use Clip when you want to
cut out a piece of one layer using one or
more of the polygons in another layer as a 'cookie cutter'. This is particularly
useful for creating a new layer that contains a geographic
subset of the features in another larger layer.
For example, suppose you are studying the transportation needs of a particular
county. You would like to work with a layer that contains only the roads
or segments of roads that fall inside this county boundary, but all you
have is a layer containing roads for the whole state. You can clip the
roads in the state roads layer using the county polygon as the 'cookie
cutter' to create a new layer containing just the roads in the county.
The layer that is having its features
clipped can contain points, lines, or polygons. If you only want a subset
of the features in this layer to be clipped, you can select them using
any of ArcMap's feature selection tools, before you start the Geoprocessing
wizard. You should then check the 'Use selected features only' box on
the second panel of the wizard just below where you specify this input
layer. |
The 'cooker cutter'
or clip layer must contain polygon features. If you only want a subset
of the polygons in this layer to be used as the 'cookie cutter', you
should select them before you start the Geoprocessing wizard. You should
then check the 'Use selected features only' box on the second panel
of the wizard just below where you specify this clip layer.
The attributes of the features in the output layer are the
same as those of the features in the layer being clipped. Unlike the
Intersect and Union geoprocessing operations, the attributes of the
two inputs are not combined.
|
Dissolve:
ArcToolBox >> DataManagement
>> Generalization
>> Dissolve

|
Use Dissolve
when you want to aggregate features based on a specified attribute.
For example, you could take a layer containing
sales data collected on a county-by-county basis and use dissolve to create
a layer containing contiguous sales regions based on the name of the sales
person in each county. Dissolve creates the sales regions by removing
the boundaries between counties represented by the same sales person.
As part of the Dissolve process, these new features can also include summaries
of any of the attributes present in the counties. For instance, the revenue
generated in the counties making up each sales region could be totaled
up to give the total revenue for each sales region. If
this operation is disabled in the first panel of the Geoprocessing wizard,
the active data frame does not currently contain a layer that can be
used as input to this process. |
The output
from this geoprocessing operation will be in the same coordinate system as the data frame, irrespective of the
coordinate system of the input layer's data source. To review the coordinate
system of the data frame, choose Data Frame Properties from the View
menu and choose the Coordinate System tab in the dialog that appears.
Dissolve may result in
multipart features being created. A multipart
feature is a single feature that contains discontiguous elements,
and is represented in the attribute table as one record. |
Für unser Problem ist die Intersect-Methode die geeignete Wahl, da allein die Altlastenverdachtsflächen weiter
untersucht werden sollen (also nicht: Union) und auf die Kombination
der Attribute aus beiden input-layers Wert gelegt wird (also nicht:
Clip).

In dem sich öffnenden Fenster sollten wir (wie stets
bei solchen räumlichen Analysen) den Environment-Parameter (Zielverzeichnis!) auf unsere PGDB
LP_Lienen setzen.
Bei der Definition der Input Features können wir sowohl mit drag & drop-Methode direkt aus dem 'Table of content' Fenster heraus oder per Auswahlmenue über den file-browser arbeiten. Ggf.
kann ein Rang (rank) der Layer angegeben werden, der die Genauigkeit der Eingabedaten angibt
(1=höchste Genauigkeit). Hier könnten wir z.B. die Landnutzung auf
Rang 1 setzen. Die Output Feature Class nennen
wir z.B. Altlasten_Intersect und speichern sie
in der PGDB LP_Lienen oder im FDS
Plandaten. Die übrigen Parameterwerte werden wie voreingestellt beibehalten. Mit OK starten wir die Berechnung, die
je nach Anzahl der Geoobjekte und geometrischer Komplexität einige Zeit
dauern kann; das Ergebnis wird sowohl als neue FC gespeichert (kann mit ArcCatalog
kontrolliert werden) als auch als neuer Layer in die aktuelle Karte eingefügt (ggf. View/Refresh aktivieren) und kann in seiner Darstellungsart (Symbology!) angepasst werden.
Ein Blick in die Attribute Table zeigt:

- Es sind (in diesem
Beispiel; bei Ihnen werden wegen der individuellen Kartierung der
Altlasten-Verdachtsflächen andere Resultate zu erwarten sein) 54
neue Polygone mit eigener Geometrie und Topologie gebildet worden.
- Die neuen Polygone
besitzen wie gewünscht die Attribute Nutzung
und Altlasten_Typ.
- Die geometrischen
Attribute Länge und Fläche der features wurden automatisch
berechnet.
- Das Attribut
ha-groesse wurde allerdings aus der FC Landnutzung ohne Neuberechnung übernommen: Jedes neu
gebildete Polygon hat die alte (falsche) ha-Größe
mitbekommen.
Wenn man mit RM auf das
Attribut ha_groesse die Zeilen der Tabelle
aufsteigend/absteigend sortiert, kann man auch in der Tabelle an dem
doppelten Auftreten von ha_groesse und Nutzung sehen, welche
Nutzungsparzellen ehemals zusammengehörten, jetzt aber durch ihre
Lage in unterschiedlichen Altlastenflächen als individuelle
Geoobjekte betrachtet werden. Natürlich sollten die ha-Werte aktualisiert werden (s.o.): RM auf ha_groesse >> Calculate values >>
ha_groesse = [Shape_Area] /10000 definieren.
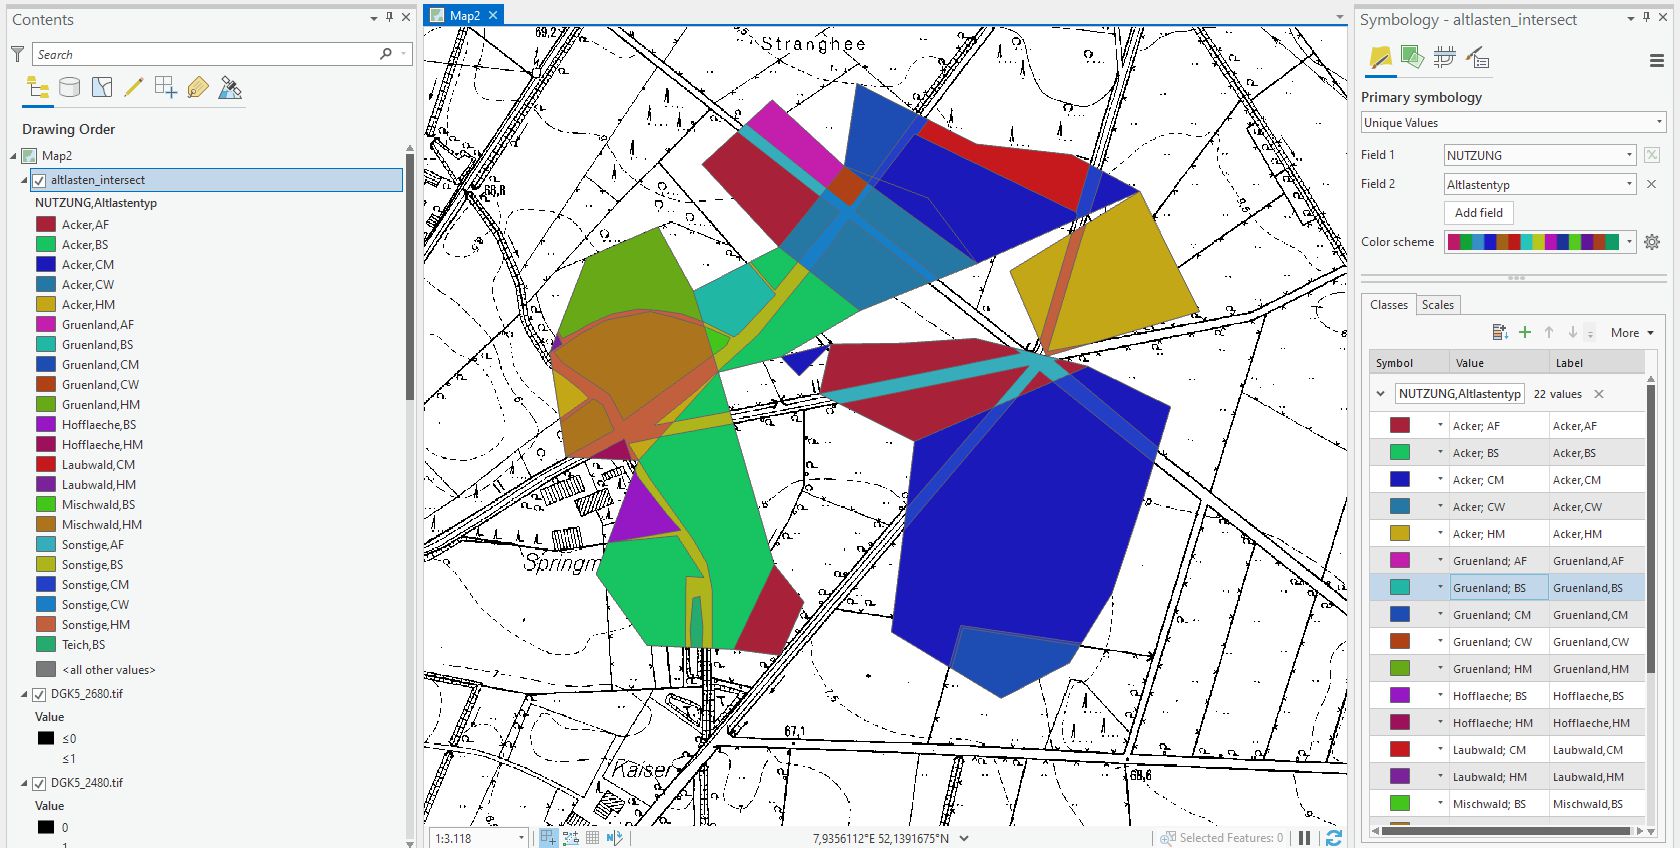
Wenn wir nun noch auf
die bekannte Weise die Legende gestalten wollen, haben wir im Fenster Layer Properties dazu drei sinnvolle
Möglichkeiten: Unter dem Tab Symbology wählen wir
- Categorie .. Unique Values mit
Value Field = Nutzung: Farb-/Symbol-Definition nur für die Landnutzungstypen
- Categorie .. Unique Values mit
Value Field = Altlast: Farb-/Symbol-Definition nur für die Altlastentypen
- Categorie .. Unique Values many
fields mit Value Fields = Nutzung und Altlast (typ) : Farb-/Symbol-Definition
für die Kombinierten Nutzungs- & Altlastentypen.
Hier ist die dritte
Variante gewählt worden. Das Erzeugen der Kombination
von Landnutzungsfarben und Altlasten-Schraffuren für die Variante 3 kann
wie folgt vorgenommen werden:
Unter Symbology wählen wir Add All
Values und bearbeiten jede einzelneLandnutzung/Altlasten-Kombination: Doppel-LM >> Farbe der Landnutzung auswählen >> Properties >> Im Symbol Property Editor mit dem +Button (links unten) ein Visualisierungs-Layer hinzufügen >> für diesen
der Property-Type Line_Fill_Symbol auswählen
und ggf. Farbe u.a. Parameter anpassen.
Um im Folgenden die Gesamtbilanz der betroffenen Landnutzungstypen über alle
Altlastenverdachtsflächen hinweg zu berechnen, greifen wir auf die Erfahrungen
beim Beispiel 7 zurück: In der Attribute Table des neuen Layers markieren wir wieder
mit LM das Attribut Nutzung, wählen mit RM
die Option Summarize und dort bei Select a field ...=Nutzung für die (inzwischen ja aktualisierte) ha_groesse die statistische Kenngröße MIn, Max, Sum etc. Die
Ausgabe-Tabelle sollte an einem geeigneten Ort gespeichert werden.
Die dem Content als neue Statistic-Tabelle hinzugefügte Datenreihe können wir wieder mit RM >> open als Tab öffnen.

In diesem Beispiel sind also Ackerflächen gefolgt von Grünland am stärksten von Altlasten-Verdachtsfällen
betroffen.
Nachdem
nun die Erfassung aller durch Altlasten betroffenen Landnutzungsflächen
im Projekt erfolgt ist, soll nun visuell überprüft werden, ob sich
bzgl. der Landnutzung selbst Veränderungen in den letzten Jahren
ergeben haben. Dazu werden aktuelle ortho-referenzierte Luftbilder der
Landesvermessung NRW (sog. Orthophotos, DOP ) für den Untersuchungsraum Lienen in das ArcGIS-Projekt internetbasiert integriert. Erstmalig wollen wir einen sogenannten www-gestützten WebMapping Service (WMS) des Landes NRW als Datendienst einbinden. Diese WMS-Dienste werden mittlerweile von vielen offiziellen Stellen angeboten und in Geodatenportalen zu Geodaten-Infrastrukturen (GDI) zusammengeschlossen. Für unsere Aufgabe nutzen wir den Service des Landes NRW, gelistet unter der allgemeinen Adresse des Geoportals NRW
https://www.geoportal.nrw/
hier suchen wir den WMS Service Deutsche Ortho Photo Karte (DOP) mit 10cm Bodenauflösung .....und deren sogenannten Capabilities für dessen Einbindung als WMS:
https://www.wms.nrw.de/geobasis/wms_nw_dop?
(Die
hier angebotenen Dienste liegen i.d.R. im WGS 84 System vor und müssen
ggf. beim Integrieren in die Karte in das Gauss Krüger System (DHDN,
wie Übungsdaten!) umprojekziert werden, z.B. von WGS84 zu DHDN oder
ETRS89)!
Ein
großer Vorteil von Geodatendiensten ist, dass man nicht selber die (tw.
großen) Datensätze lokal vorhalten muss, sondern Sie einfach für die
Dauer einer GIS-Sitzung 'ausleiht', d.h. nur gemeinsam mit den eigenen
Daten visualisiert. Dafür müssen die Daten einem Standard genügen,
welcher es Programmen wie ArcGIS Pro erlauben, die angebotenen Raster-
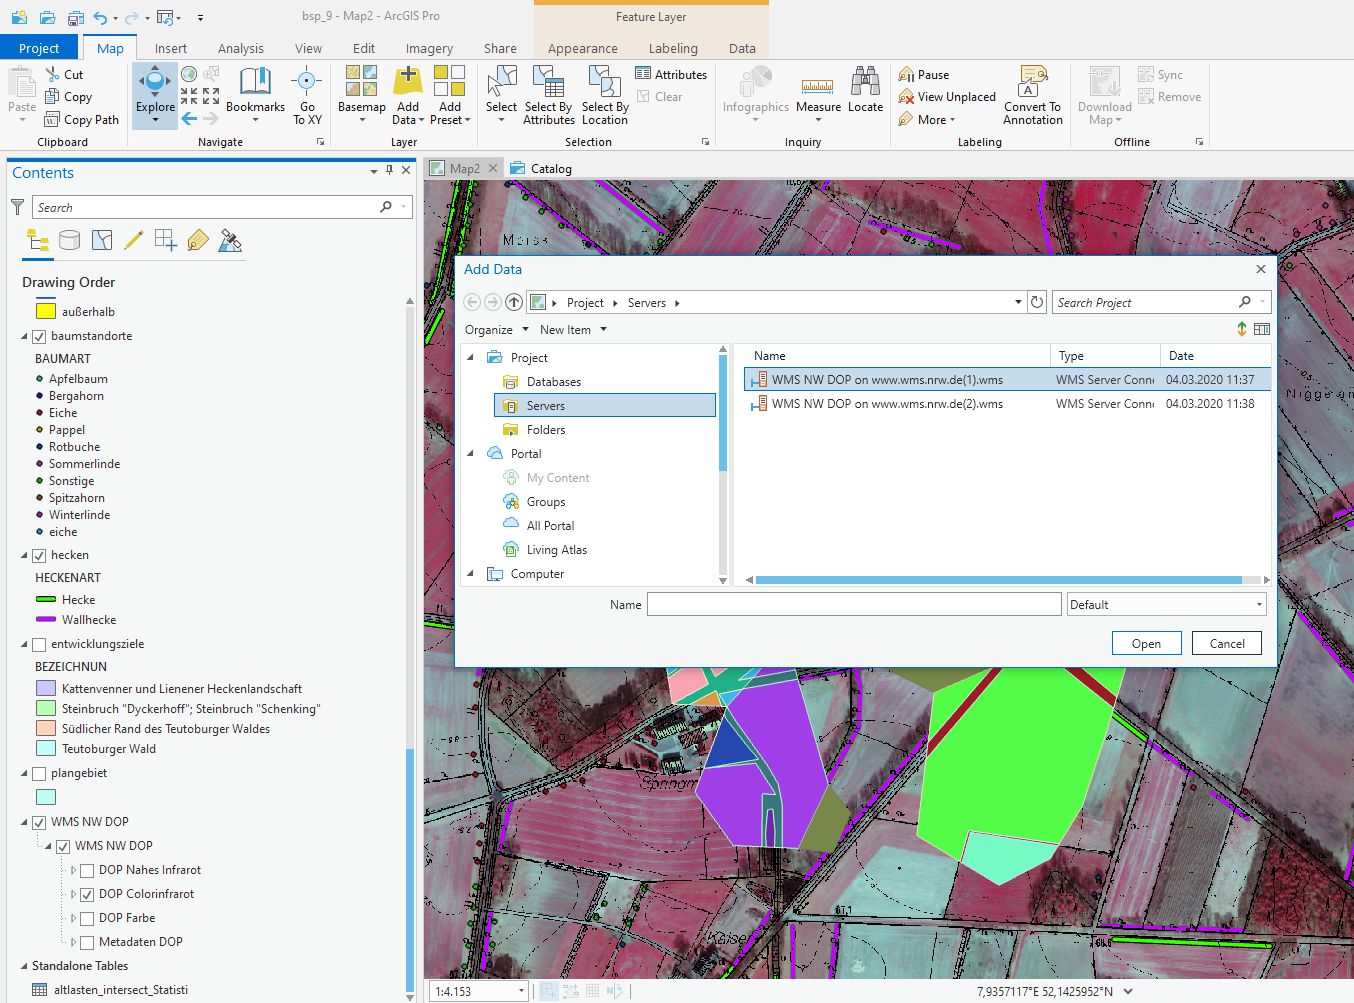
oder Vectordaten als Layer zu importieren. Wir gehen zunächst so vor,
als würden wir einen zusätzlichen Layer im Projekt LP_Lienen hinzufügen, wählen aber im Auswahlmenue anstatt einer lokalen Datei einen WMS Dienst (GIS Server) aus (diesen haben wir zuvor im Geodatenportal DOP NRW bestimmt und kopiert).
Die weitere Auswahl der Quelle erfolgt in ArcGIS Pro im Haupmenue 'Insert' >> connections >> New WMS Server

Im
weiteren Menueverlauf werden wir zur Eingabe der URL gebeten - diese
haben wir zuvor aus den Eigenschaften des Ortho-NRW DOP kopiert - den
Eingabeprozess abschliessen. Die Adresse wird nun dauerhaft als unter add data >> projects >> server als Datenquelle mit angeboten.
Hinweis:
In
manchen Fällen muss noch eine Umreferenzierung des Bezugssystems des
WMS von WGS84 auf das gültige Projekt-Bezugssystem, also DHDN mittels
Methodenauswahl (Transformation - 3. Methode im Auswahlfenster)
erfolgen.)
Nach Auswahl der Orthobilder als zusätzlichen Layer ermöglicht uns der
Blick auf das Projektgebiet rasch eine Einschätzung der sichtbaren
Nutzungänderungen (z.B. Wiesen und Äcker vs. Hecken und Infrastruktur).
In unserem Beispiel (s.o.) wurde die die Darstellung der
Altlasten-Intersects auf die Colorinfrarot-Bildreihe gewählt -
ggf. Landnutzungslegende auf 50% Transparenz setzen, je nach Wunsch!